Diagramming: Visualizations
YouDesign allows you to add dynamic visualizations to your boards, turning them into interactive dashboards.
YouDesign offers dynamic visualizations that transform your boards into interactive dashboards, providing real-time insights and an enhanced user experience.
Available Visualization Types
You can add the following types of visualizations to your board:
| Visualization Type | Description |
|---|---|
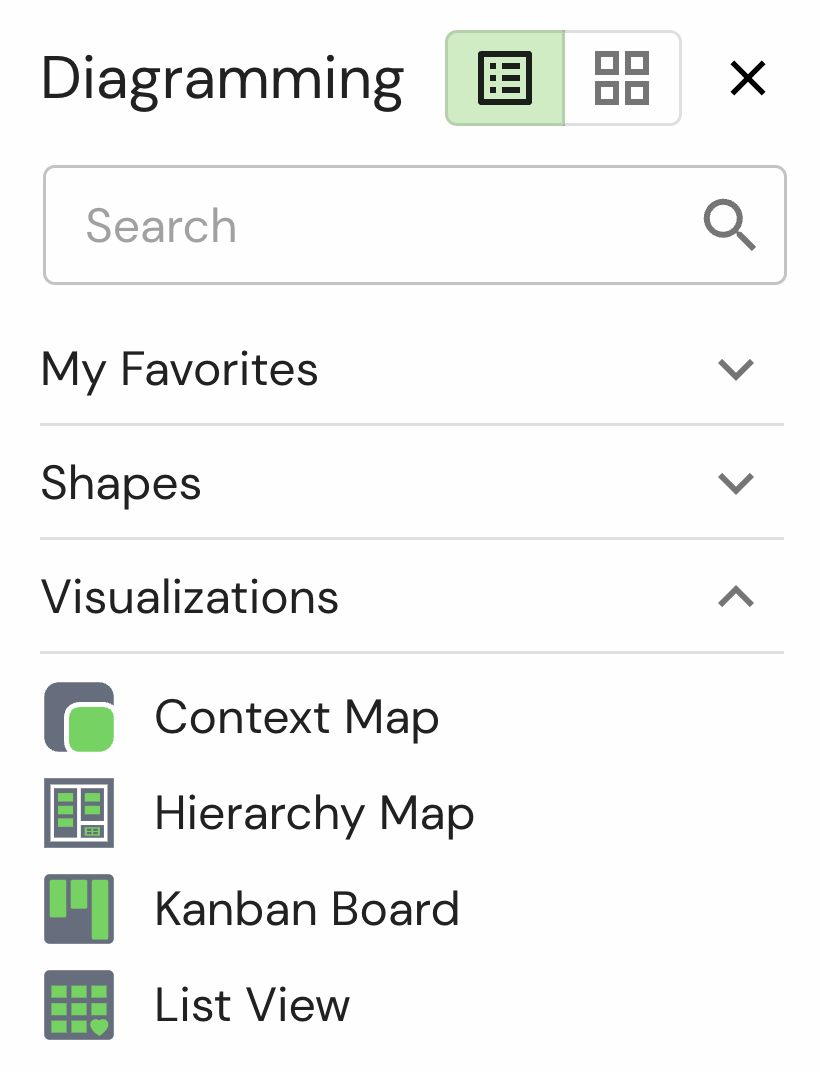
| Context Map | Offers a visual representation of the context and connections between various elements within your board. |
| Hierarchy Map | Displays hierarchical relationships between items, ideal for visualizing parent-child structures within a system. |
| Kanban Board | Organizes tasks or items into columns for workflow visualization, enabling you to manage project statuses easily. |
| List View | Presents data in a list format, perfect for viewing a linear arrangement of items or tasks. |
Adding Visualizations
You can add visualizations to your board in the same way you add shapes:
Click & Click Method:
- Select the desired visualization from the Shapes library in the Diagramming panel.
- Single-click on the visualization.
- Move your mouse over the canvas and click to place the visualization at the desired location.
Drag & Drop Method:
- Select the desired visualization from the Shapes library.
- Click and hold the visualization, then drag it to the desired location on the canvas.
- Release the mouse button to drop the visualization.
Enhancing Visualizations with the Data Hub
After adding visualizations, you can populate them using the Data Hub:
- Current State Items: Use the Data Hub to add real-time items and reflect the current state of your data.
- Future State Items: Add shapes or other elements to visualize future states and planning within your board.
Updated over 1 year ago