Realtime Indicators (RTI)
Realtime Indicators (RTI) in YouDesign use color to highlight important data in boards and diagrams, improving clarity and decision-making. Users can apply RTIs to shapes, set the indicators based on specific fields, and interact with them to filter and analyze content. RTIs can be refreshed to display the latest data and are also viewable in Presentation Mode, providing a dynamic, real-time view of essential information. Admins can configure RTIs for advanced use within the platform.
Introduction to Realtime Indicators (RTI)
Realtime Indicators (RTI) provide a visual way to interpret field values in YouDesign, using colors and visual cues to enhance the readability of boards and diagrams. This feature makes it easy for users to identify important information at a glance, facilitating quicker decision-making.
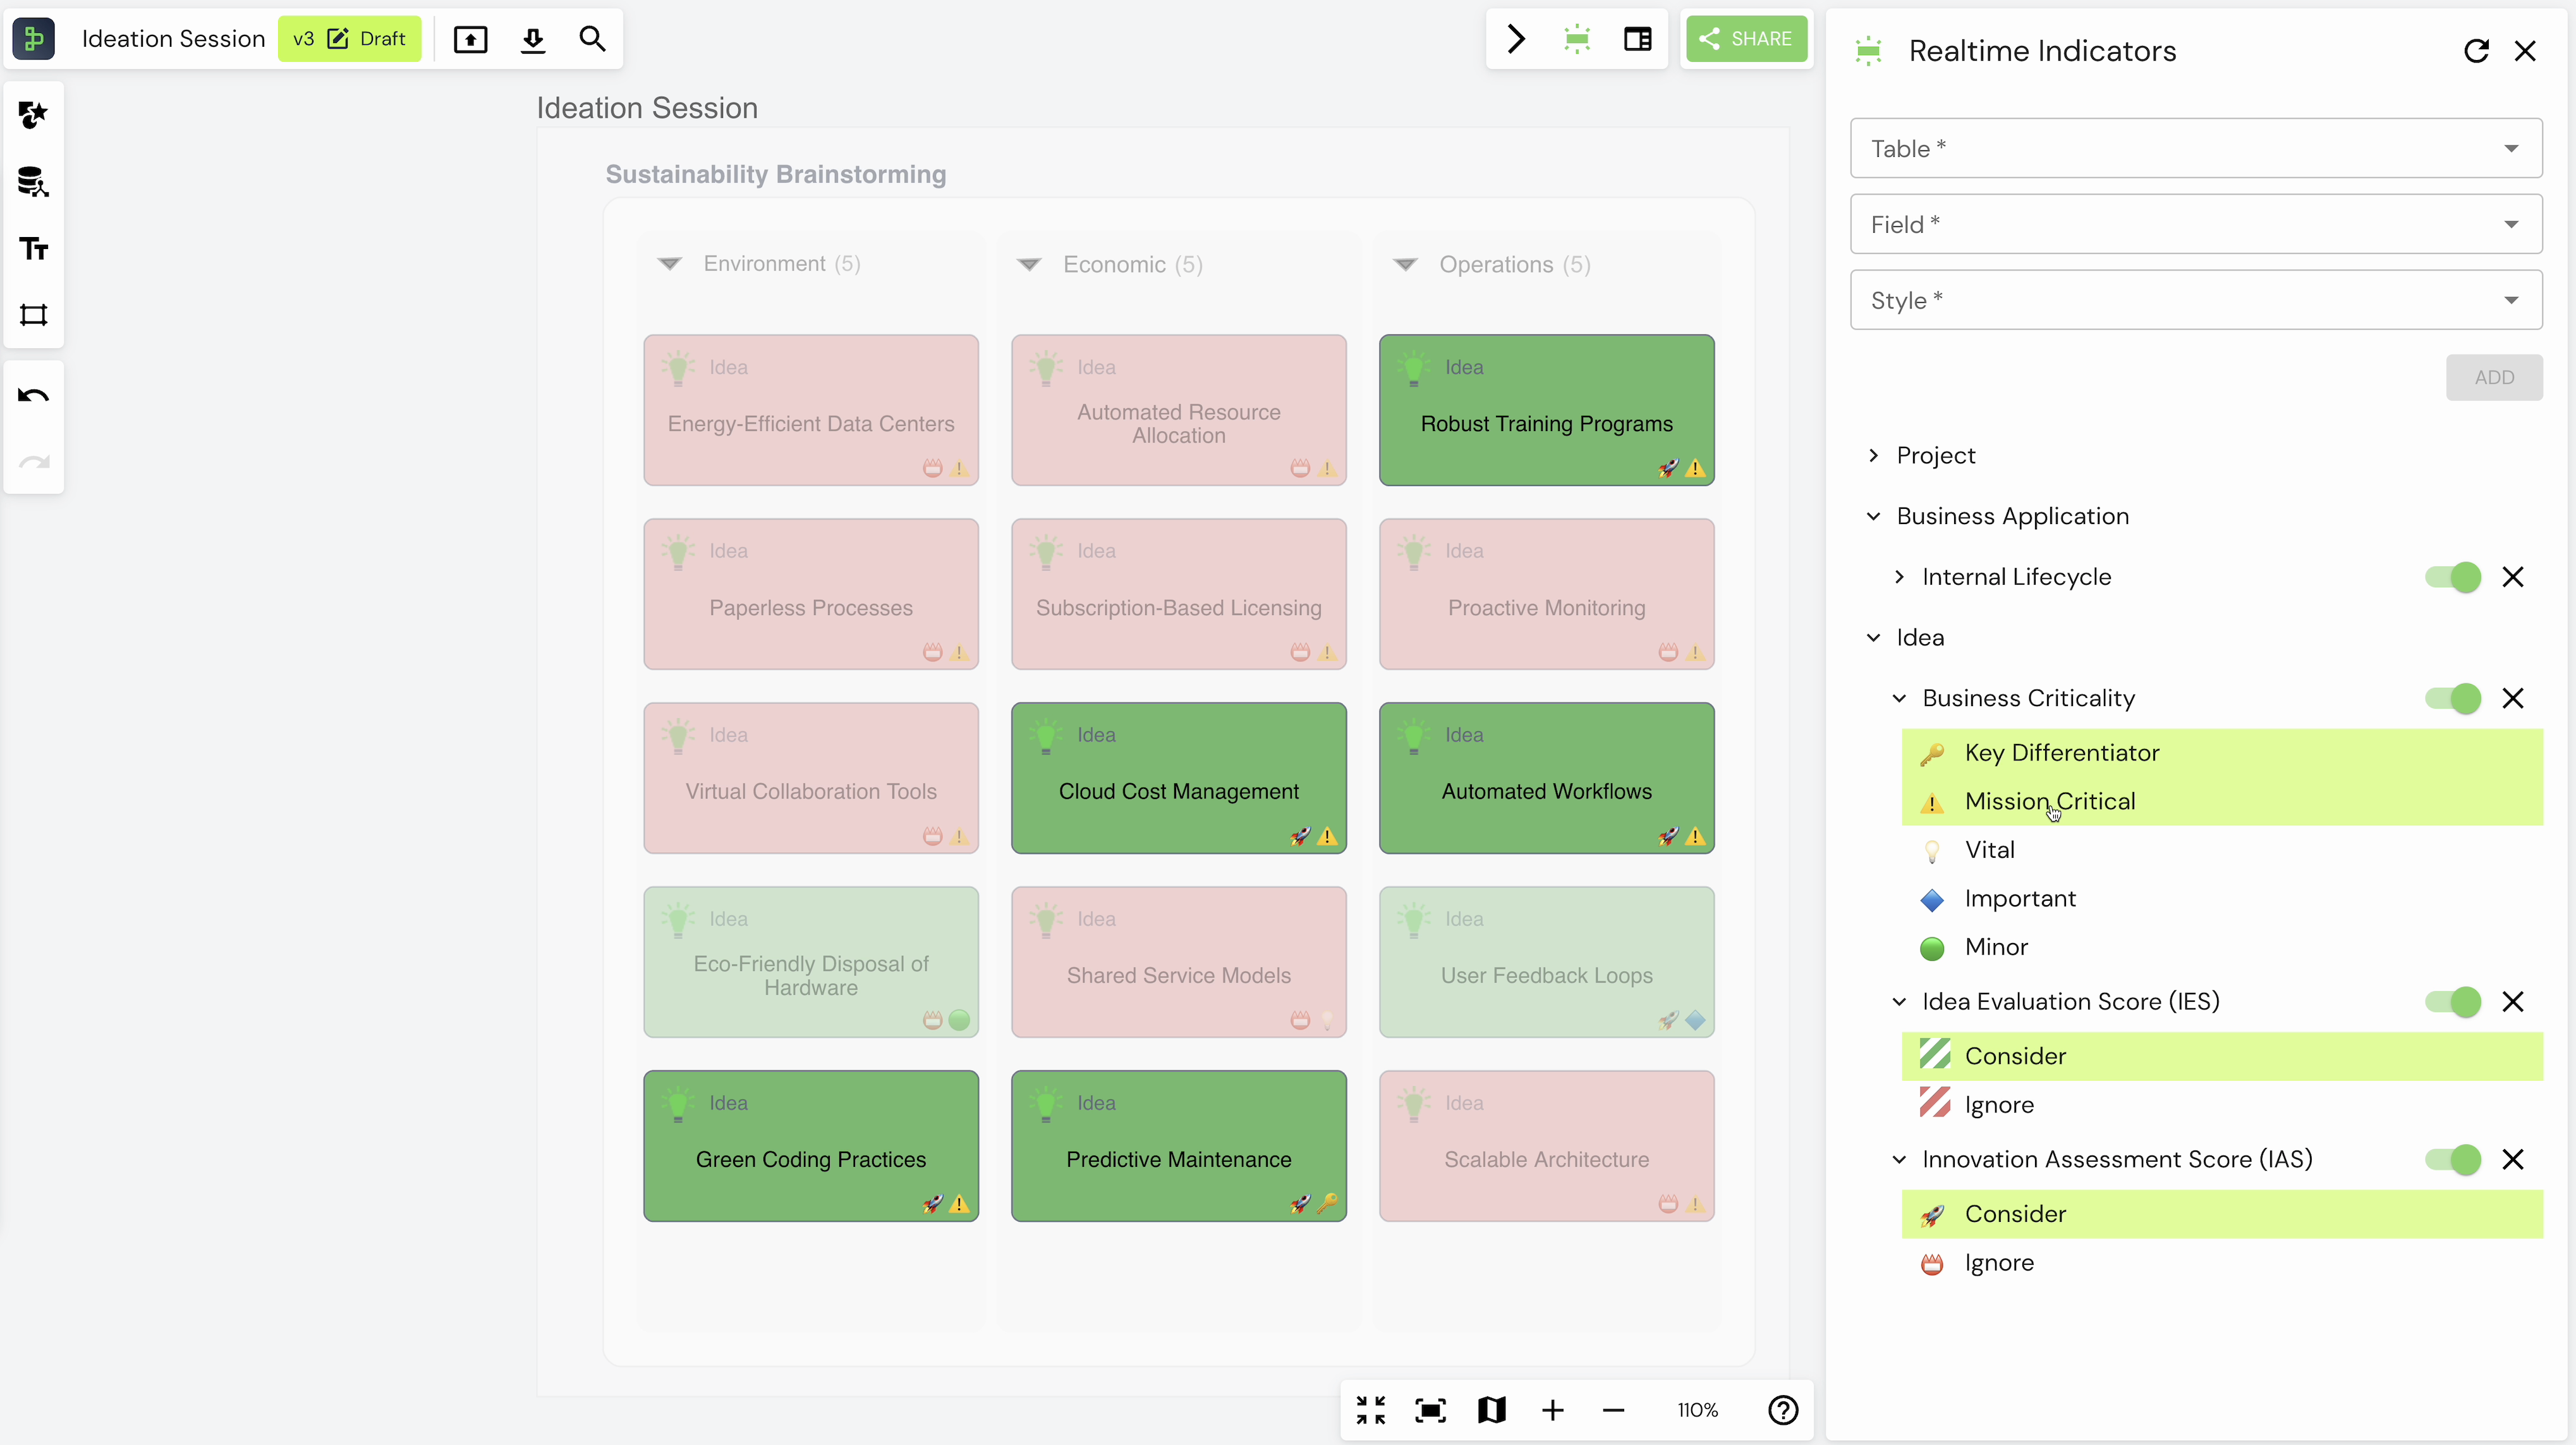
Realtime Indicators applied on Board content.
Applying Realtime Indicators
To apply Realtime Indicators to your board, follow these steps:
- Open the board in Edit Mode.
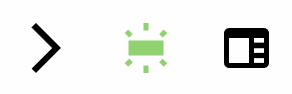
- Click the Realtime Indicator Icon in the top right widget toolbar.
- The Realtime Indicator Panel will appear on the right side of the screen.
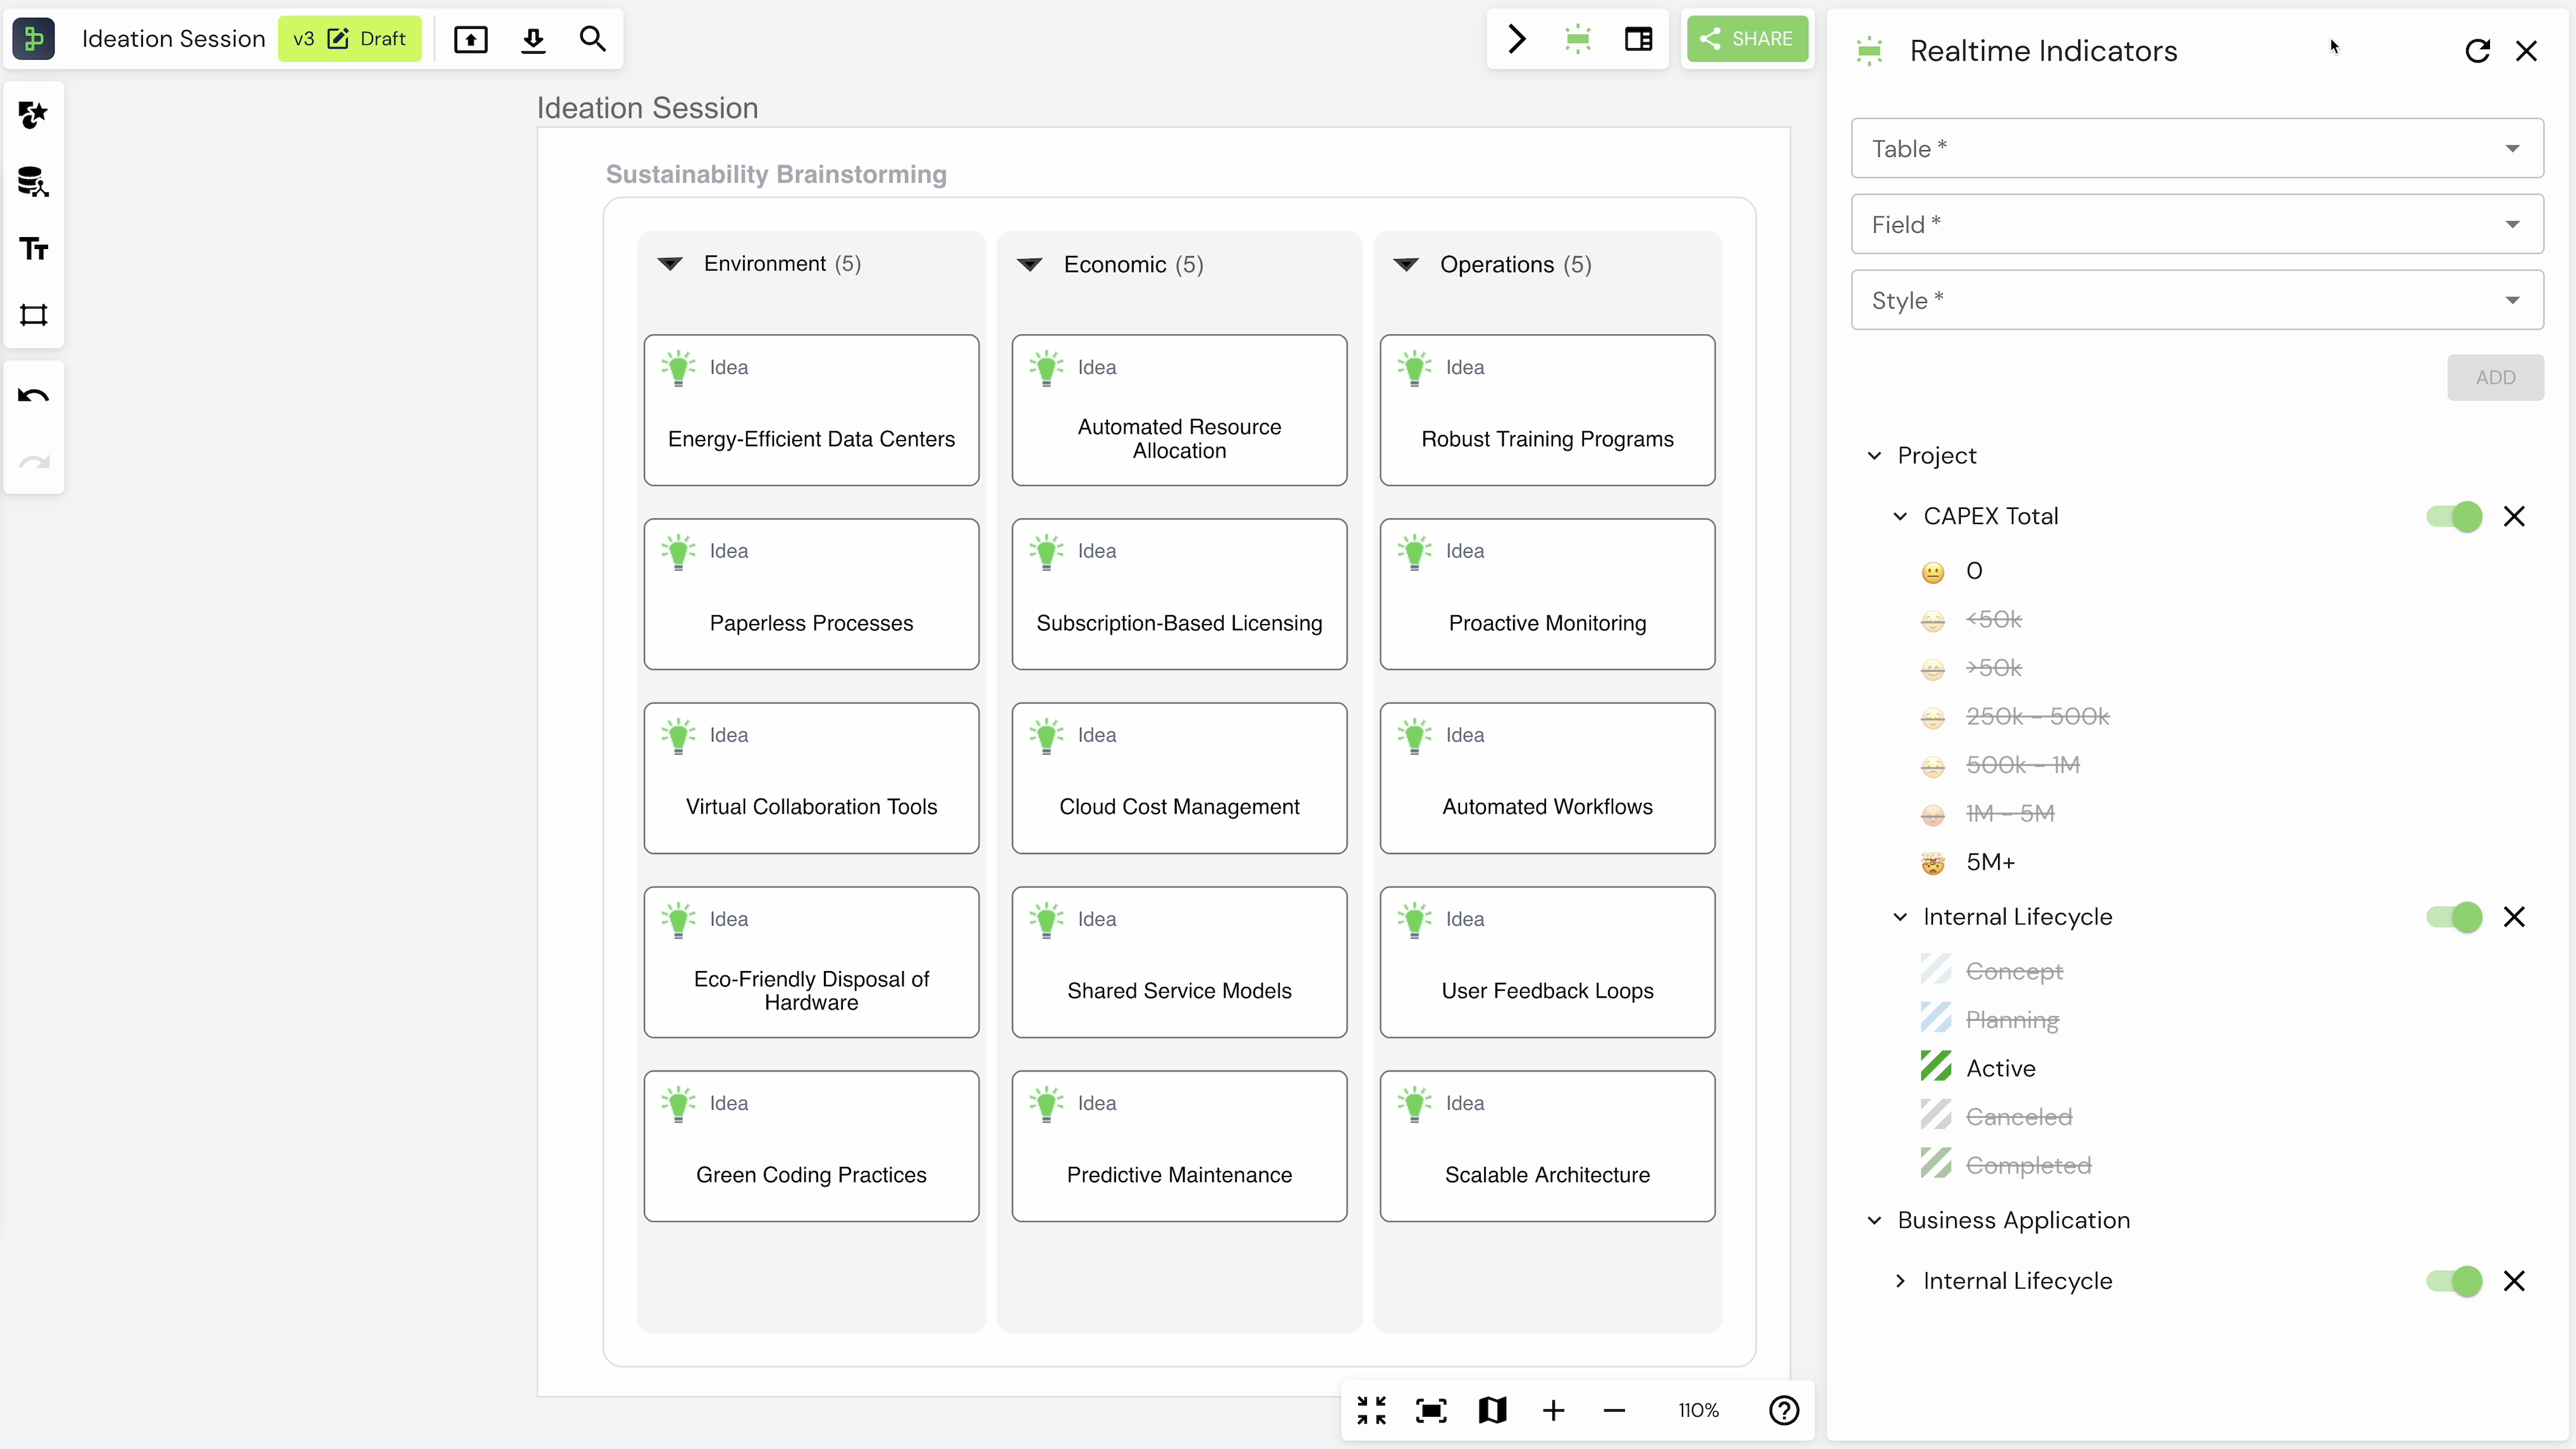
- The RTI panel has two sections:
- The top section allows you to select a table, field, and style of the Realtime Indicator.
- The bottom section is the Legend, showing all the selected and applied Realtime Indicators.
- Select the table, field, and style for the RTI. You can position the RTIs within or outside of the shape. After your selections, click the Add button to apply the RTI.
Interacting with Realtime Indicators
The RTI Legend is your main interface for managing, highlighting, and filtering RTI data.
- Expand/Collapse the Legend, which is organized by Table > Field > Indicator Value.
- You can toggle the ON/OFF switch to enable or disable the RTIs or remove them by clicking the X icon.
- Clicking on an Indicator Value will highlight its associated shapes. You can select multiple values to apply an AND/OR logic to filter and analyze the data.
Note: Once a Realtime Indicator is applied, it cannot be selected again.
Refreshing Realtime Indicators
Use the Refresh button at the top of the RTI panel to reload the latest backend data and ensure that your indicators reflect the most up-to-date information.
Using Realtime Indicators in Presentation Mode
In Presentation Mode, users can view but not modify or delete the Realtime Indicators.
Realtime Indicators Configuration
Admins can configure Realtime Indicators within YouDesign. For more detailed configuration instructions, refer to the Realtime Indicators Configuration KB.
Updated over 1 year ago