Hierarchy Map
Our Hierarchy Map provides a clear, structured view of records arranged in parent–child relationships. Instead of working with flat lists, it presents data in a tree-like format that highlights how elements are grouped, related, and dependent on one another. This visualization works with any table and adapts to the chosen dataset with configuration options, you can tailor the results to your needs—focusing on high-level categories for an overview or drilling down into detailed records for deeper analysis.
Key Features
-
Relationship Visualization: easily understand parent–child structures through a clear, tree-based view.
-
Simple Drag-and-Drop : add records from the Data Hub or Canvas with a quick drag-and-drop.
-
Configurable Structure: select tables, apply filters, and tailor how your hierarchy is built.
-
Customizable Layout: adjust alignment, style, and layout to match your preferred viewing experience.
This video will get you started with key aspects of Hierarchy Map in YouDesign:
How to Use
Add the Hierarchy Map to the Canvas
Like any other visualization, you can add it from Diagramming Panel > Visualization Section > Hierarchy Map. Simply drag and drop it onto the canvas.
Adding Hierarchy Map into the canvas
Load data
To begin, you need to define a primary table (starting table). There are two ways to do this:
- From Configuration: Select the Hierarchy Map, open the configuration panel from the toolbar, and choose your primary table.
Load data - from Configuration
From Data Hub: Drag elements from your Data Hub into the Hierarchy Map. This will add the selected elements along with their children (based on parent/child relationships).
Load Data - from Data Hub
- From the Canvas: Dragging elements from the canvas will add them as records, but without parent/child relationships.
Load Data - from Canvas
Extend your data
After setting your primary table, you may want to see how it connects to other tables. To extend the hierarchy:
- Open the Configuration window.
- Select an additional table to include.
- The selected table will appear under your primary table in the Included Tables list.
- Click Apply to save your changes and regenerate the results.
Extending Data in Configuration Dialog
Tip: You can also click Load Related Tables when hovering over a table. This will automatically include all existing classes related to the target table, saving you from manually adding them one by one.
Filter your data as needed
Open the Configuration window and click the Filter icon next to the table selector. This will display a filter interface similar to the one available in the Data Hub.
By default, the Hierarchy Map automatically inherits all filters from the Data Hub. However, changes you make here—such as enabling or disabling filters—will be saved specifically for this Hierarchy Map instance.
When finished, apply the filters and then click Apply in your Configuration window to refresh and regenerate your results.
Interface Overview
Toolbar options
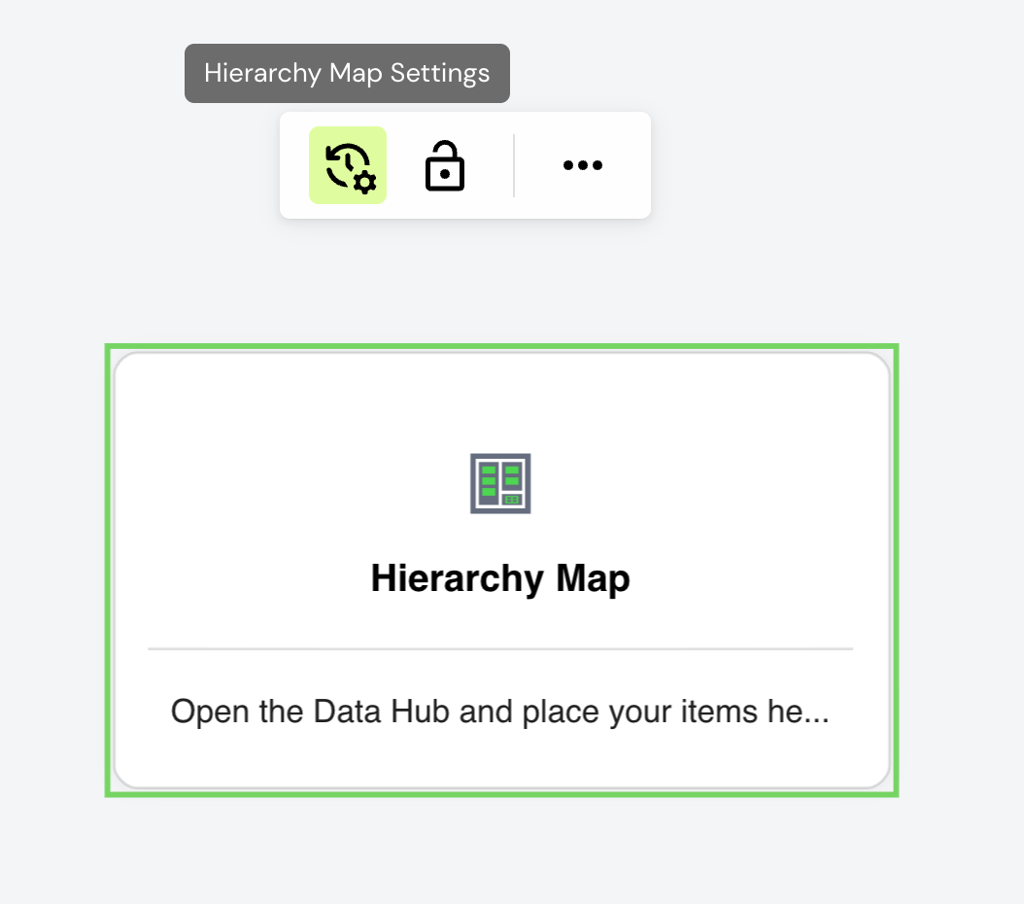
Hierarchy Map - Toolbar Setting without content
Configuration Button: appear always when selecting the Hierarchy Map with or without data.
Toolbar options with content
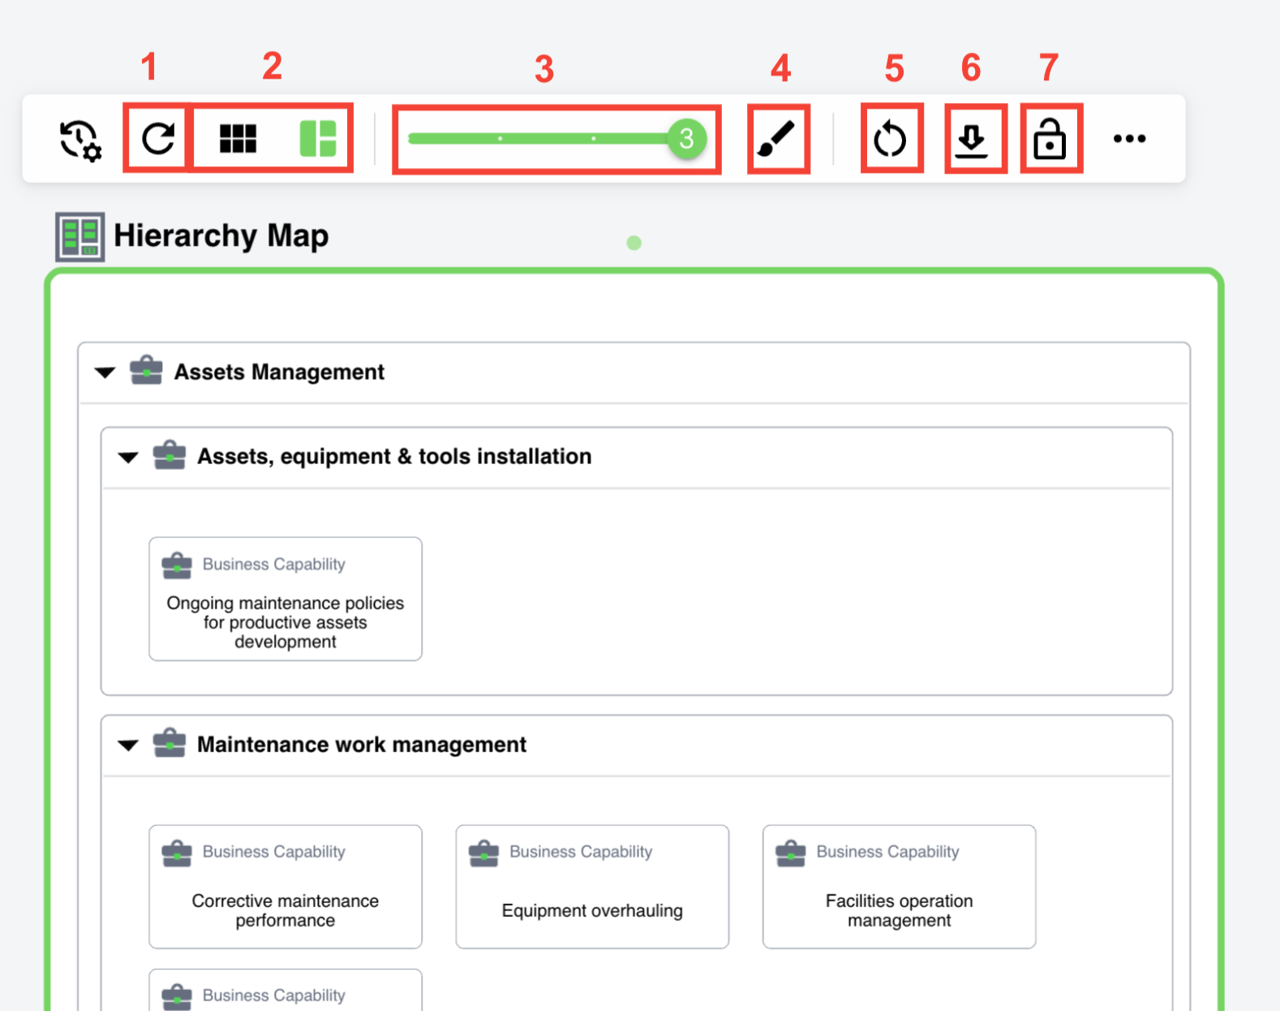
Hierarchy Map - Toolbar Setting with content
- Refresh – Rebuilds the Hierarchy Map based on the current configuration.
- Alignment Options and Autolayout – Provides options to change how the content is aligned.
- Level Slider – Filters the content by hierarchy level.
- Style Options – Allows you to change background and border colors.
- Reset – Clears all configuration and content, restoring the Hierarchy Map to its initial state.
- Export – Exports the map as an image.
- Lock – Locks the Hierarchy Map, treating it like any other fixed shape on the canva
Setting Dialog
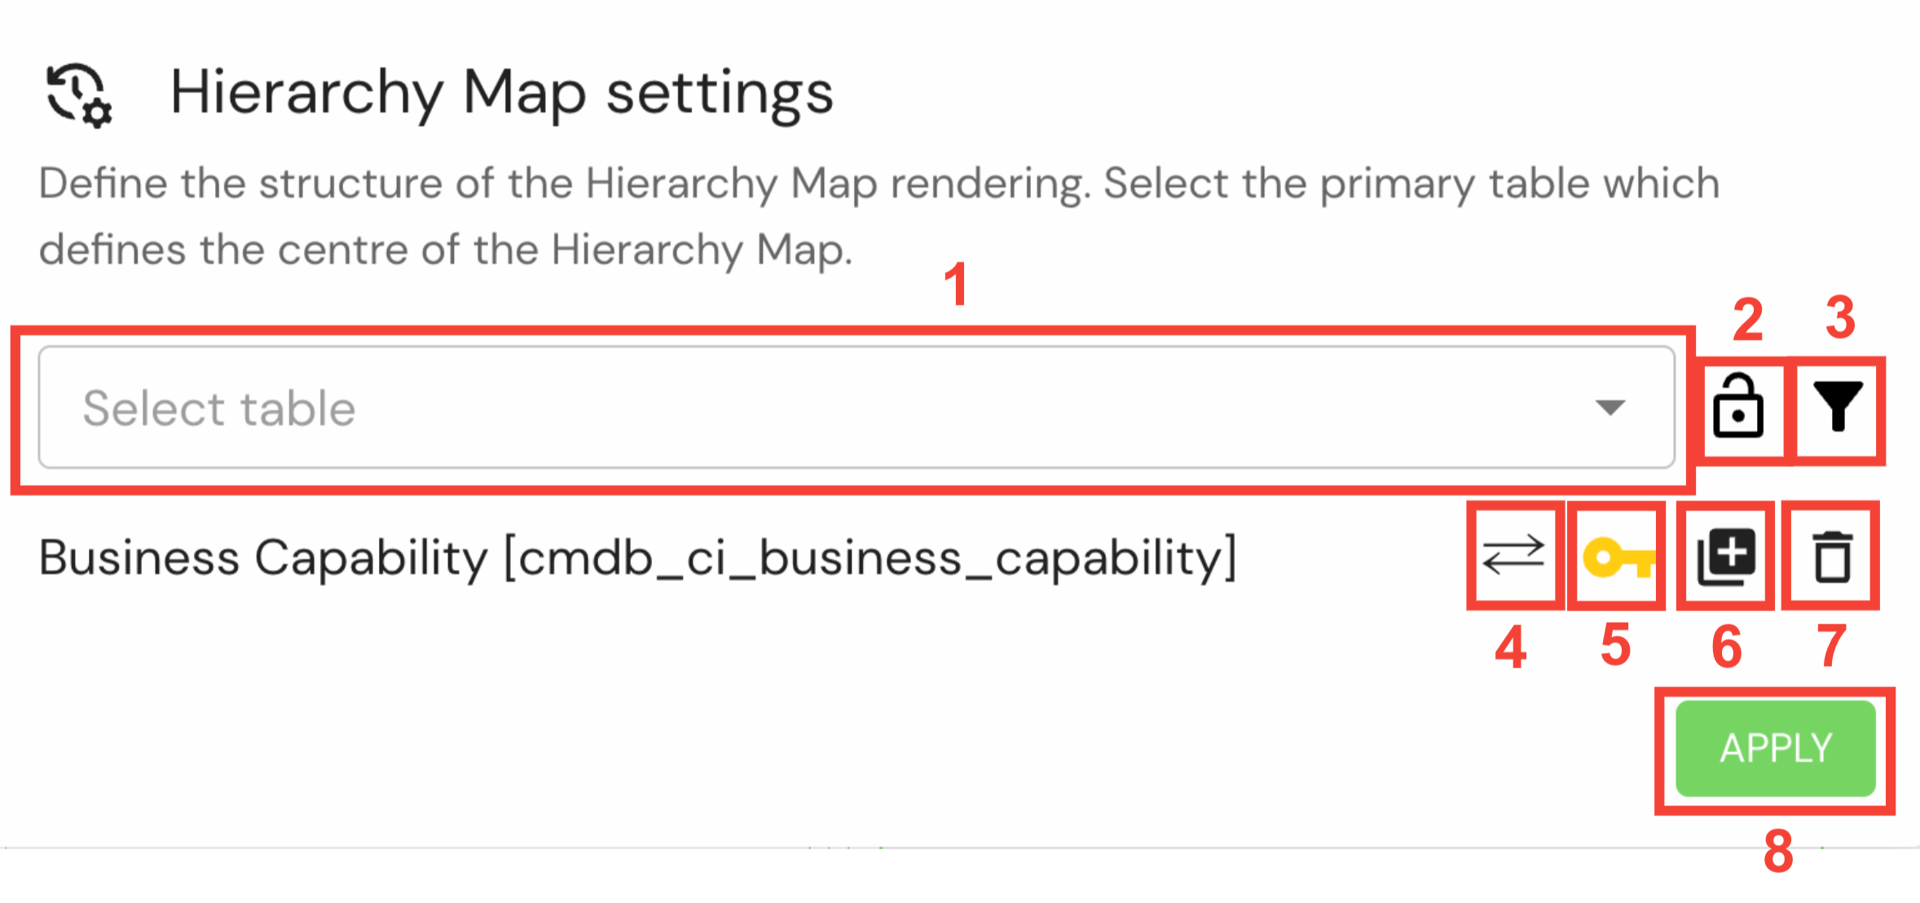
Hierarchy Map - Setting Dialog
- Table Selector – Allows you to add tables to the list. If no tables are added, the first one will automatically become the primary table.
- Lock Table – Prevents new tables from being automatically added to the list when dropping them into the Hierarchy Map.
- Filter – Opens filter options, similar to those available in the Data Hub Filters.
- Load CI Relationships – Loads CI relationships for the selected primary table when enabled.
- Primary Table Indicator – Marks the selected table as the primary table. Only one table can be set as primary at a time. Changing it will remove previously dropped elements.
- Load Related Tables – Loads all tables associated with the selected table based on existing relationships.
- Delete Table – Removes the selected table entry from the configuration.
- Apply – Saves your settings and regenerates the Hierarchy Map with the updated configuration.
Level Slider
Control Hierarchy Levels with Ease
The Level Slider in the context toolbar lets you choose the depth of detail you want to see in the Hierarchy Map.
How it works?
- The Level Slider in the context toolbar lets you choose the depth of detail you want to see in the Hierarchy Map.
- Simply drag the slider to hide complex nested levels and focus on the information that matters most to you. This feature ensures a clearer and more tailored view of your project's structure, enhancing your overall experience with YouDesign.
- Dynamic Display: Adjusting the slider hides items with higher levels of nesting. Groups without children, due to hidden items, are converted into simple data hub items for clarity.
When you drop elements into the Hierarchy Map, the maximum level of nesting is automatically preselected based on the data.
Alignment Options and Autolayout
Auto Layout
- When auto-layout is ON, Hierarchy Map will automatically adjust its borders according to the content inside.
Customize Layout
- Available only when Auto Layout is toggled OFF.
- Change the number of stacked rows and columns of elements in the hierarchy map, customizing the layout to suit your preferences.
Tips for Effective Use
- Start with the Basics: Begin by dragging key elements onto the Hierarchy Map to establish the core structure.
- Add Details: Expand on each element by adding more data to provide a comprehensive overview.
- Experiment with Layouts: Play around with the orientation and arrangement of elements to find the most effective visual representation.
- Use Frames to easily organize and quickly find what you need on your YouDesign Board.
The YouDesign Hierarchy Map is a versatile tool that empowers you to visualize and manipulate the structure of your content with ease.
Whether you're planning projects, organizing data, or analyzing relationships, the Hierarchy Map is here to enhance your workflow and provide a clear, visual understanding of your content.
Start mapping your ideas today with YouDesign!
Updated 4 months ago